")
")
For your research projects, you need to:
- Quantify the expression of a gene
- Detect and estimate the relative quantity of a pathogen, a virus...
- Genotype from SNPs analysis
- Detect and determine the number of copies of a gene
- Check the quality of your cocultures and validate a production test.
Real-time PCR or quantitative PCR (qPCR) is one of the most appropriate techniques to meet these needs: derived from PCR, this technique is used to detect, characterize and quantify nucleic acids for many applications.
qPCR is generally realized from DNA, but for some specific applications such as gene expression, RNA will be used as a starting material; in this case, the technique is called RT-qPCR (Reverse Quantitative Transcription PCR).
More precisely, real-time PCR differs from conventional PCR by the use of markers allowing to monitor the reaction progress. The data collected at each cycle are analyzed by computer to characterize one or more genes (Presence or absence, level of expression...)
qPCR is a PCR during which it is possible, through a fluorescent labelling, to continuously monitor/follow the amplification of a DNA fragment. Fluorescence intensity is measured at each cycle, reflecting the quantity of products amplified over time.
As shown in the graph (fluorescence = f(number of cycles)) reported below, the fluorescence and therefore the number of amplified fragments increases with the number of cycles. The resulting curve shows 3 phases:
- Background noise phase: The number of amplified fragments is too small to allow the emitted fluorescence to exceed the detection threshold, and the signal remains undetectable.
- Exponential phase: The quantity of amplified fragments increases exponentially (the number of fragments doubles with each cycle) allowing the emission of a fluorescent signal above the detection threshold of the device. On a logarithmic representation, this increase will be displayed as a line.
- The plateau (or saturation phase): The reaction mixture is depleted in (certain) all elements necessary for the exponential amplification that no longer allows exponential growth. That is why we then observe a stagnation of the amount of fluorescence and of the number of copies of the amplified fragment.
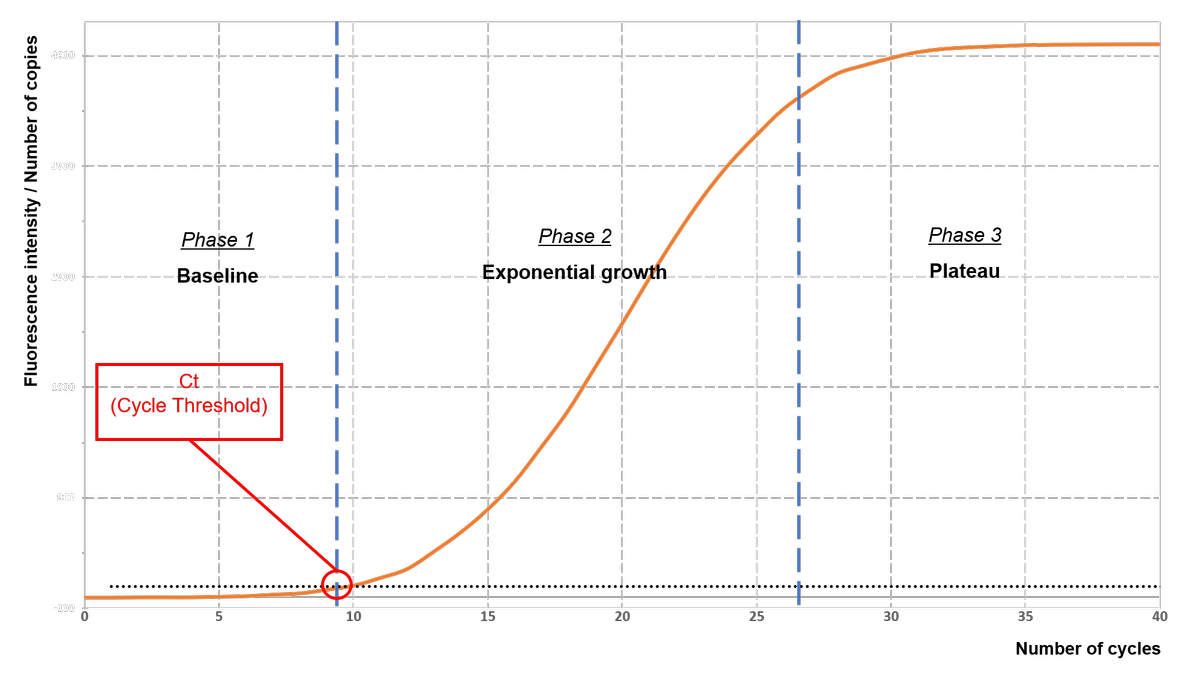
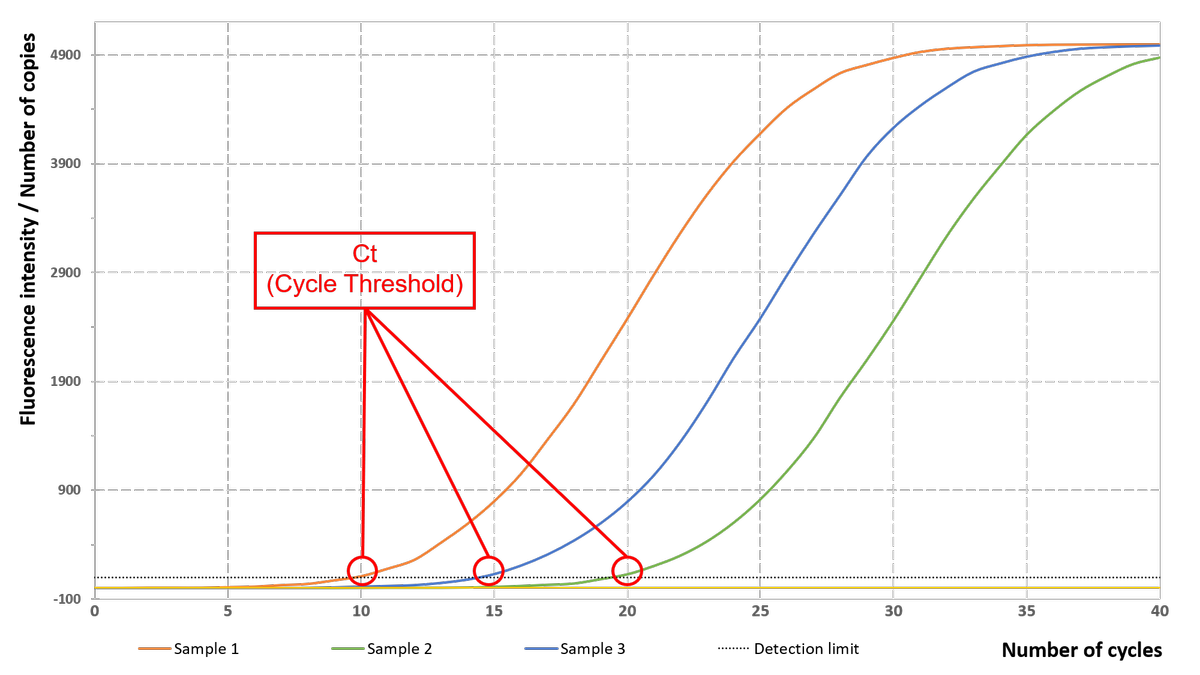
The higher the initial number of copies of the target gene is, the lower the number of cycles required for the fluorescence intensity to significantly exceed the detection threshold. This number of cycles, located at the beginning of the exponential phase is called Ct (Cycle Threshold) and is used as a basis to analyse the results of qPCR.
Real-time PCR, therefore, differs from end-point methods since the data collected after the appearance of Ct are not critical to the analysis.
This technique has many advantages due to the variety of chemistries available.
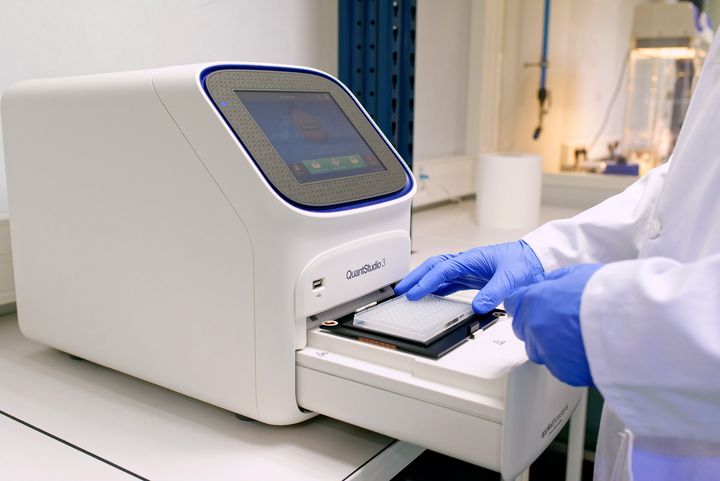
Equipped with a QuantStudio 3 Applied biosystem device, we are able to offer you two different chemistries for your qPCRs:
- The use of SYBR® Green: fluorophore emitting only when incorporated into a double-stranded DNA molecule.
- The use of TaqMan® labeled probes: specific to the genes that you aim to amplify, these probes are degraded during the elongation phase, thus releasing fluorescence.
Biomnigene is able to advise you on the choice of sequences that can be analyzed simultaneously, the chemistry to be used, the design of primers and/or probes, or the development of the experimental protocol for your project/for the realization of your projects.